Investment Analysis Templates
Complete investment analysis toolkit with ROI calculations....
One-time purchase • Download link via email
Used by managers at
Included in Financial Planning & Analysis Toolkit
12 templates for $249
1,900+ professionals use this template
⭐ 4.8/5 rating from verified users
How This Template Works
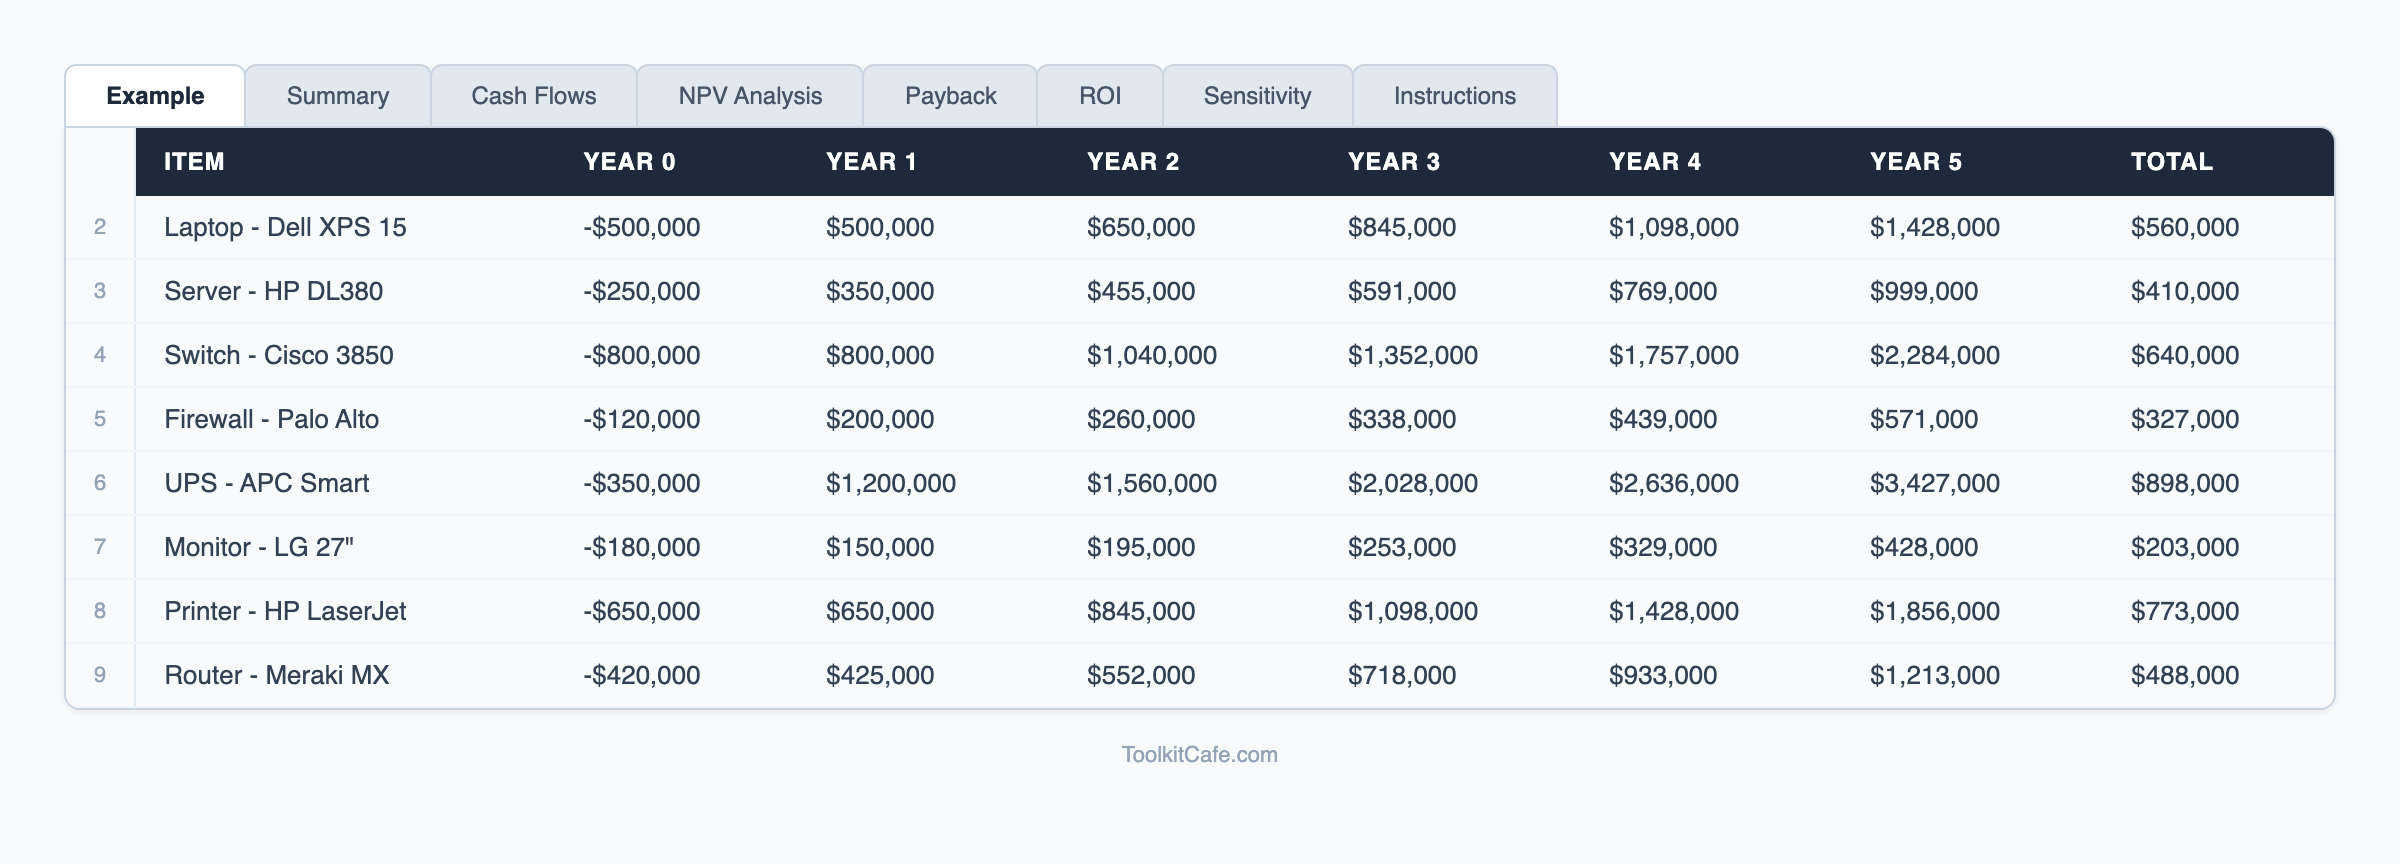
Capital allocation decisions are only as good as the analysis behind them. Whether you're evaluating a new product line, a technology investment, a real estate acquisition, or an M&A opportunity, the Investment Analysis Templates give finance managers and business analysts the rigorous toolkit they need — NPV, IRR, payback period, sensitivity analysis, and multi-investment comparison matrices — all in a single professional workbook.
The DCF model drives NPV and IRR from projected free cash flows, with explicit assumptions for discount rate, terminal value, and growth — and a sensitivity table that shows how the investment decision changes under different rate and growth combinations. The payback period calculator handles both simple and discounted payback, which matters for investments where the time value of money is significant relative to the project life. When evaluating multiple competing projects, the comparison matrix ranks options across NPV, IRR, payback, and strategic fit score, giving leadership a defensible framework for capital allocation decisions.
For teams building the underlying cash flow projections that feed this analysis, our [financial projections templates](/templates/financial-projections) provide the three-statement model that generates the free cash flows used in the DCF. Organizations formalizing their investment governance process should also review our [enterprise budgeting and forecasting templates](/templates/enterprise-budgeting-forecasting) for the capex planning and approval workflow integration.
Complete Your Toolkit
Bundle these templates and save 20%
Accounting Setup Templates
Comprehensive accounting systems setup toolkit with chart of accounts....
Asset Management Templates
Comprehensive asset management toolkit with asset registers....
Break-Even Analysis Calculator
Professional break-even analysis calculator with scenario modeling, profitability analysis, and cost
Learn More About Financial Planning
Comprehensive guides and best practices to help you implement this template effectively
5 Essential IT Policies Every Business Needs: Complete Implementation Guide
Protect your business with these critical IT policies. From acceptable use to incident response, get detailed implementation guidance, compliance mapping, and templates for the five policies every organization needs.
Read guide →Agile Project Management Templates: Scrum, Kanban & Sprint Planning Tools
Free agile project management templates for Scrum teams. Download sprint planning spreadsheets, Kanban boards, velocity trackers, and retrospective templates for Excel and Google Sheets.
Read guide →Agile & Scrum Methodology for IT Projects
Complete Agile and Scrum guide for IT teams. Implement sprints, daily standups, and iterative development with proven templates and best practices for faster delivery.
Read guide →Complete Resource Collection
Access our comprehensive collection of financial planning templates, guides, and tools all in one place.
Explore Financial Planning Resource CollectionExplore More Resources
Discover comprehensive guides and templates in our resource hub
Browse all financial planning resources, guides, and templates
Frequently Asked Questions
What is the difference between NPV, IRR, and payback period — and when should I use each?
NPV (Net Present Value) tells you the dollar value an investment creates after accounting for the cost of capital — use it to compare the absolute value of competing investments. IRR (Internal Rate of Return) tells you the effective annual return — use it to compare against your hurdle rate. Payback period tells you how quickly you recover the initial outlay — use it when liquidity or risk is the primary concern. This template calculates all three so you can make a well-rounded decision.
How do I determine the right discount rate (WACC) for my analysis?
The template includes a WACC calculator where you input your cost of equity (using CAPM or management judgment), cost of debt (interest rate net of tax benefit), and capital structure (debt/equity split). For project-level analysis, many teams use a hurdle rate set by the CFO or board — typically 8–15% for corporate investments.
Can I use this template for real estate investment analysis?
Yes. The DCF model and payback calculations apply directly to real estate investments. You would input net operating income projections as the cash flows, use a cap rate or property-specific discount rate, and model the terminal value as a reversion sale. The sensitivity table is particularly useful for testing NOI growth and cap rate exit assumptions.
How many investment scenarios can the comparison matrix handle?
The comparison matrix evaluates up to 8 investments simultaneously, ranking them across NPV, IRR, payback, and a customizable strategic fit score. Weightings for each criterion are adjustable, so you can reflect your organization's priorities in the scoring. For more than 8 investments, duplicate the matrix tab.
Ready to Get Started?
⚡ 23 professionals downloaded this template today
Stop wasting time building from scratch. Get instant access to our proven Investment Analysis Templates and see results today.
30-day money-back guarantee • Download link via email • Professional support